MLBA Lab 1 - Introduction to Quarto
An introduction to Quarto
02.03.2026
What is Quarto?
- Quarto® is an open-source scientific and technical publishing system built on Pandoc.
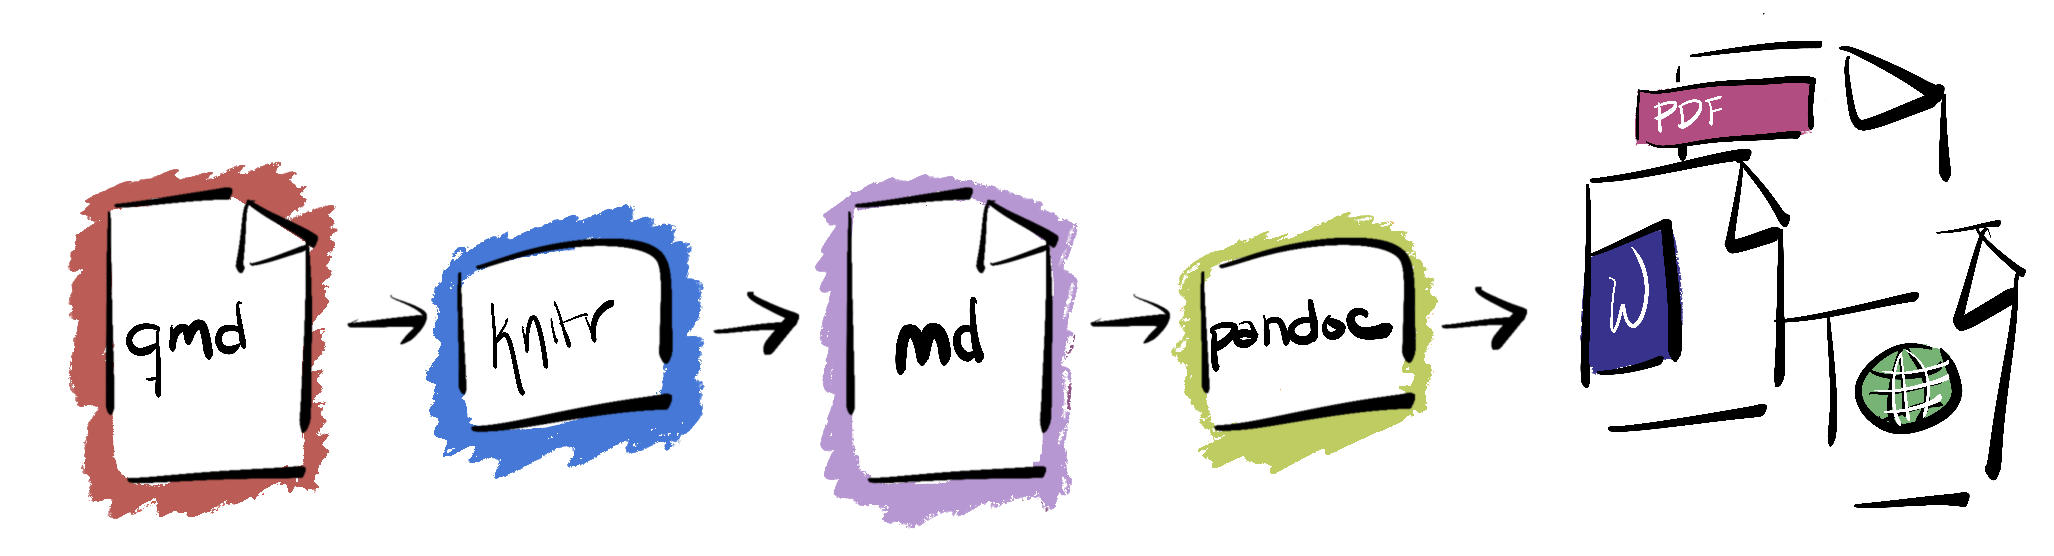
- Pandoc is a versatile tool for converting documents from one format to another. It allows you to convert a document written in one markup language to another markup language, such as converting a Markdown document to HTML or LaTeX.
- Think of Quarto as R-markdown on steroids.
Formats
Compatibility
![]()
![]()
![]()